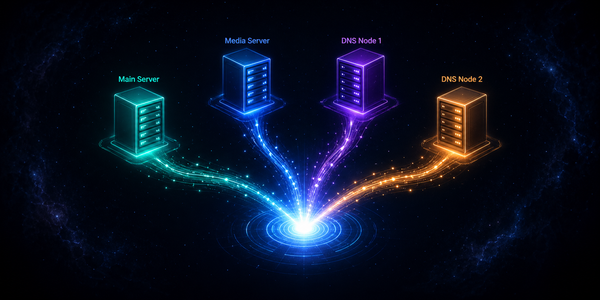
At this point Nexus is logging everything on its own host. That's useful, but it's not centralized logging — it's just logging with a nicer interface. The goal is one place to search logs from every machine in the lab. That means getting Fluent Bit running on Vault, both Pi-hole instances, and anything else worth monitoring.
The approach is simple: Loki only runs on Nexus. Every other host runs a lightweight Fluent Bit agent that ships logs to Nexus over the network. No Loki on the remote hosts. No Grafana on the remote hosts. Just Fluent Bit doing its one job.
If you haven't read Articles 1 and 2, go do that first. This one picks up where those left off.
Opening Up Loki to the Network
By default we bound Loki to 127.0.0.1:3100 — local connections only. Before remote hosts can ship logs to it, that needs to change. Update the ports section in your compose file on Nexus:
  loki:
    ports:
      - "192.168.1.2:3100:3100"
This binds Loki to your LAN IP instead of localhost. Reachable from your network, not from the internet.
Restart Loki and verify it's accessible from another machine:
docker compose up -d loki
curl http://192.168.1.2:3100/ready
Should return ready. If it does, you're good to proceed.
Setting Up Fluent Bit on Vault
Set a proper hostname first so logs show up with a meaningful label:
ssh vault
sudo hostnamectl set-hostname vault
Create the Fluent Bit directory:
mkdir -p /home/youruser/docker-projects/fluent-bit/config
cd /home/youruser/docker-projects/fluent-bit
Create docker-compose.yml:
services:
  fluent-bit:
    image: fluent/fluent-bit:3.2.10
    container_name: fluent-bit
    volumes:
      - ./config/fluent-bit.conf:/fluent-bit/etc/fluent-bit.conf:ro
      - ./config/fluent-bit-parsers.conf:/fluent-bit/etc/parsers_custom.conf:ro
      - ./config/container_name.lua:/fluent-bit/etc/container_name.lua:ro
      - /var/lib/docker/containers:/var/lib/docker/containers:ro
      - /var/log:/var/log:ro
      - /run/log/journal:/run/log/journal:ro
    restart: unless-stopped
    deploy:
      resources:
        limits:
          memory: 256M
          cpus: "0.5"
        reservations:
          memory: 64M
    logging:
      driver: "json-file"
      options:
        max-size: "5m"
        max-file: "2"
The key difference from Nexus: outputs point to 192.168.1.2 instead of the container name loki, since Loki isn't running locally on this host.
Create config/fluent-bit.conf:
[SERVICE]
    Flush         5
    Daemon        Off
    Log_Level     warn
    Parsers_File  /fluent-bit/etc/parsers.conf
    Parsers_File  /fluent-bit/etc/parsers_custom.conf
    HTTP_Server   On
    HTTP_Listen   0.0.0.0
    HTTP_Port     2020
    storage.type  filesystem
    storage.path  /tmp/flb-storage/
    storage.sync  normal
    storage.checksum off
    storage.max_chunks_up 128

# ─── INPUTS ───────────────────────────────────────────────────────────────────

[INPUT]
    Name              tail
    Tag               docker.*
    Path              /var/lib/docker/containers/*/*.log
    Exclude_Path      *fluent-bit*
    Parser            docker
    DB                /tmp/flb_docker.db
    Mem_Buf_Limit     32MB
    Skip_Long_Lines   On
    Refresh_Interval  10

[INPUT]
    Name              tail
    Tag               syslog
    Path              /var/log/syslog
    Parser            syslog-rfc3164
    DB                /tmp/flb_syslog.db
    Mem_Buf_Limit     8MB

[INPUT]
    Name              systemd
    Tag               systemd
    Systemd_Filter    _SYSTEMD_UNIT=docker.service
    Systemd_Filter    _SYSTEMD_UNIT=ssh.service
    Read_From_Tail    On
    Strip_Underscores On

# ─── FILTERS ──────────────────────────────────────────────────────────────────

[FILTER]
    Name    lua
    Match   docker.*
    script  /fluent-bit/etc/container_name.lua
    call    extract_container_id

[FILTER]
    Name          record_modifier
    Match         *
    Record        host vault

[FILTER]
    Name    grep
    Match   docker.*
    Exclude log .*health.*check.*
    Exclude log .*GET /ping.*
    Exclude log .*GET /health.*

# ─── OUTPUTS ──────────────────────────────────────────────────────────────────

[OUTPUT]
    Name              loki
    Match             docker.*
    Host              192.168.1.2
    Port              3100
    Labels            job=docker, host=vault
    Label_Keys        $container_name
    Line_Format       json
    Retry_Limit       10

[OUTPUT]
    Name          loki
    Match         syslog
    Host          192.168.1.2
    Port          3100
    Labels        job=syslog, host=vault
    Line_Format   key_value
    Retry_Limit   10

[OUTPUT]
    Name          loki
    Match         systemd
    Host          192.168.1.2
    Port          3100
    Labels        job=systemd, host=vault
    Line_Format   key_value
    Retry_Limit   10
Copy the parser and Lua files from Nexus:
scp nexus:/home/youruser/docker-projects/logStack/config/fluent-bit-parsers.conf config/
scp nexus:/home/youruser/docker-projects/logStack/config/container_name.lua config/
Start it up and verify:
docker compose up -d
docker compose logs fluent-bit
Clean startup with no errors. Give it 60 seconds then check from Nexus:
curl -G http://192.168.1.2:3100/loki/api/v1/label/host/valuesYou should see vault in the list alongside nexus.
The GELF Discovery
Here's where things got interesting.
After setting up Fluent Bit on Vault, several containers weren't showing up in Grafana at all. Their Docker log paths didn't exist. docker inspect showed an empty LogPath. Fluent Bit had nothing to tail.
The culprit was a logging block buried in some old compose files:
    logging:
      driver: gelf
      options:
        gelf-address: "udp://192.168.1.50:12204"
        tag: "container_13"
GELF is a log shipping protocol used by Graylog. At some point during a previous failed attempt at centralized logging, I'd configured these containers to ship logs directly to a Graylog instance. A Graylog instance that no longer existed. The containers had been faithfully firing logs into the void for — I don't know how long. Weeks. Possibly months.
When a container uses the GELF log driver, Docker doesn't write to the standard JSON log file at all. Fluent Bit's tail input has nothing to find. The fix is straightforward — remove the logging block from each affected compose file and recreate the containers:
docker compose down && docker compose up -dVerify the fix worked:
docker inspect container_name | grep -A3 "LogConfig"You want to see this:
"LogConfig": {
    "Type": "json-file",
    "Config": {}
}
Anything other than json-file is why your logs are missing. Check for this first if containers aren't showing up in Loki.
Handling Application Log Files
Some applications don't log to Docker's stdout at all — they write to files inside the container. Plex is the classic example, maintaining detailed log files at:
/config/Library/Application Support/Plex Media Server/Logs/Yes, that path has spaces in it. We'll get to that.
First, find where the application's config is mounted on the host:
docker inspect plex --format '{{range .Mounts}}{{.Source}} -> {{.Destination}}{{"\n"}}{{end}}'In my case Plex's config is at /media/disk1/PlexServerData/database on the host, mapping to /config inside the container. So the log files live at:
/media/disk1/PlexServerData/database/Library/Application Support/Plex Media Server/Logs/The spaces problem: Docker volume mounts with spaces in the path can fail silently. The mount just doesn't happen — no error, nothing. You stare at the config for 20 minutes wondering why Fluent Bit can't see the files. The fix is a symlink:
ln -s "/media/disk1/PlexServerData/database/Library/Application Support/Plex Media Server/Logs" /home/youruser/plex-logsMount the symlink instead. Add to Vault's docker-compose.yml:
- /home/youruser/plex-logs:/fluent-bit/plex-logs:roAdd the input to fluent-bit.conf:
[INPUT]
    Name              tail
    Tag               plex.logs
    Path              /fluent-bit/plex-logs/*.log
    DB                /tmp/flb_plex.db
    Mem_Buf_Limit     16MB
    Skip_Long_Lines   On
    Refresh_Interval  10
And the output:
[OUTPUT]
    Name          loki
    Match         plex.*
    Host          192.168.1.2
    Port          3100
    Labels        job=plex, host=vault, container_name=plex
    Line_Format   key_value
    Retry_Limit   10
One more thing: Fluent Bit's default image is distroless — no shell, no ls, no cat. If you need to debug what the container can actually see, switch to the debug image temporarily:
image: fluent/fluent-bit:3.2.10-debugThen exec in with docker exec -it fluent-bit sh and poke around. Switch back when you're done.
Adding Pi-hole Log Collection
Pi-hole logs to /var/log/pihole/ inside the container. That path isn't exposed by default, so add a volume mount to the Pi-hole compose file:
    volumes:
      - './etc-pihole:/etc/pihole'
      - './pihole-logs:/var/log/pihole'
Recreate the Pi-hole container:
docker compose down && docker compose up -dVerify the log files appear:
ls pihole-logs/
# Should show: pihole.log, FTL.log, webserver.log
For the Pi-hole running on Nexus, add the log directory to Nexus's Fluent Bit volume mounts:
- /home/youruser/docker-projects/pihole-v6/pihole-logs:/fluent-bit/pihole-logs:roAdd the inputs and output to Nexus's fluent-bit.conf:
[INPUT]
    Name              tail
    Tag               pihole.dns
    Path              /fluent-bit/pihole-logs/pihole.log
    DB                /tmp/flb_pihole.db
    Mem_Buf_Limit     8MB
    Skip_Long_Lines   On
    Refresh_Interval  10

[INPUT]
    Name              tail
    Tag               pihole.ftl
    Path              /fluent-bit/pihole-logs/FTL.log
    DB                /tmp/flb_pihole_ftl.db
    Mem_Buf_Limit     8MB
    Skip_Long_Lines   On
    Refresh_Interval  10

[OUTPUT]
    Name          loki
    Match         pihole.*
    Host          loki
    Port          3100
    Labels        job=pihole, host=nexus, container_name=pihole
    Line_Format   key_value
    Retry_Limit   10
For the second Pi-hole on Sentinel, deploy a Fluent Bit instance on that host using the same pattern as Vault — same compose structure, same config, just with host=sentinel in the labels and Host 192.168.1.2 in the outputs.
Keep Your Host Labels Clean
Fluent Bit's ${HOSTNAME} environment variable resolves to the container's internal hostname — a random hex string Docker assigns. Not useful as a label.
Always hardcode the host label in both the record_modifier filter and the output Labels:
[FILTER]
    Name          record_modifier
    Match         *
    Record        host vault

[OUTPUT]
    Labels        job=docker, host=vault
If you end up with container ID host labels in Loki from before you caught this, clean them up with the delete API:
curl -X POST "http://192.168.1.2:3100/loki/api/v1/delete?query=%7Bhost%3D%22a257fe58eef7%22%7D&start=2024-01-01T00:00:00Z&end=2026-12-31T00:00:00Z"Deletions aren't instant — the compactor processes them based on the retention_delete_delay setting, which is 2 hours in our config. Be patient.
Querying Multiple Hosts in Grafana
With multiple hosts feeding into Loki, you can write some actually useful queries. In Grafana's Explore view:
All logs from a specific host:
{host="vault"}A specific container across all hosts:
{container_name="plex"}Errors across your entire infrastructure:
{job="docker"} |~ "(?i)(error|exception|fatal)"Everything from Pi-hole:
{job="pihole"}All jobs at once:
{job=~"docker|syslog|pihole"}The =~ operator uses regex matching. Useful for broad queries across multiple label values.
Where We Are
- ✅ Nexus — Docker containers, syslog, systemd, Pi-hole logs
- ✅ Vault — Docker containers, syslog, application log files
- ✅ Sentinel — Pi-hole logs
- ✅ Human-readable host and container labels across all hosts
- ✅ Everything searchable from one Grafana instance
The Series
- Introduction & Architecture –– Stop Flying Blind, Series Introduction
- Setting Up the Core Stack — Loki, Grafana, and Fluent Bit on your main host
- Shipping Logs from Multiple Hosts — expanding Fluent Bit across your network
- Metrics with Prometheus — node_exporter, Pi-hole metrics, and Proxmox monitoring
- Alerting — getting notified when things actually break
- Lessons Learned — everything that went wrong and how we fixed it
In Article 4 we shift from logs to metrics. Prometheus, node_exporter on every host, Pi-hole metrics, and full Proxmox cluster visibility. By the end you'll have dashboards showing CPU, memory, disk, and network for every machine in the lab — including ZFS pool health.
Go make another coffee. Article 4 has more moving parts.